Did you know that, according to reports, over 4 million mobile apps are available on the Google Play Store and Apple App Store?
From the healthcare sector to the entertainment sector, the app market has infiltrated almost every industry. Not just users but nowadays, any business that needs a reason to expand its services turns to mobile applications. Entrepreneurs targeting to develop mobile apps must read this mobile app usage and growth statistics guide to plan their app development accordingly.
It’s not just service expansion; global businesses are considering mobile app development for multiple reasons, which usually include improving their brand image, expanding their service area, building a loyal customer base, enhancing their ROI, and more.
Nowadays, app stores are flooded with many likely app types, so it’s a must to explore mobile app development trends to make your app shine in the year 2026 and beyond by looking at trending mobile app usage statistics.
To be “The One” you need to perform a perfect market analysis. It includes everything starting from your goals, target audience, the purpose of the application, and more to enhance the app growth.
These things depend on various mobile app statistics. So, here we are sharing mobile app statistics covering all the aspects that can help you be sure about your mobile app development growth.
Key Mobile App Usage Statistics
Various app owners usually determine their mobile app growth based on the number of downloads. So, starting with app download statistics, in 2026, consumers are projected to download 143 billion mobile apps from the Google Play Store and 38 billion downloads from the App Store.
That’s fascinating, right? But before proceeding with advanced mobile application usage statistics, it’s essential to understand the basic stats focusing on the growth of the mobile world.
- 87% of smartphone users spend their mobile time on apps.
- The gross revenue for both the App Store (AS) and Google Play (GP) would rise at a CAGR of 8.09% and 13.07% by the end of 2026. The breakup would be $72 billion (GP) and $161 billion (AS) in 2026.
- There are currently over 4.8 billion mobile phones in use.
- China has around 974 million smartphone users, the highest number in the world.
- The worldwide app download count crossed 257 billion downloads in the previous year.
- Gaming applications are predicted to cross the 176.1 billion downloads by 2027.
- Apple iPad’s global tablet market share is projected to rebound to around 40% in 2026, up from recent declines, including the 32% in Q1 2024, driven by shipment growth and premium model demand.
- In the 3rd quarter of 2025, Android had the global market share of 79%.
- Mobile applications generated over $782 billion in revenue by 2029.
- The total revenue is expected to reach US$673.80bn by 2027.
Is this all? Of course not. The mobile app industry itself has grown and is still growing for the better. There are some advanced app usage statistics focused on mobile app user growth rates that are shaping the app development world for its betterment.
Google Play VS App Store – App Usage Statistics
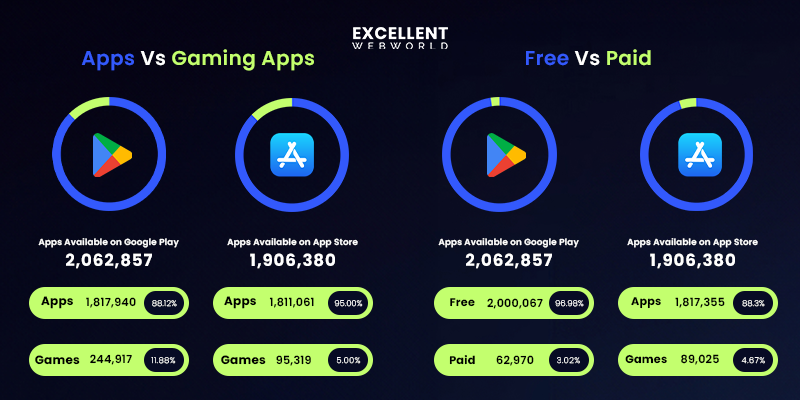
- In 2025, the Google Play Store had 2,062,857 apps, while the App Store had around 1,906,380 applications.
- Mobile apps fall into two major categories. The Google Play Store has around 1,817,940 mobile apps and 244,917 mobile games, while the App Store has 1,811,061 apps and 95,319 games.
- Across all apps, the Google Play Store offers 2,000,067 free apps (96.98%), while the Apple App Store offers around 1,817,355 (95.33%).
- Among the major 49 categories, the top 7 categories on Google Play Store are Education, Business, Tools, Food & Drinks, Entertainment, Shopping and Productivity.
- When it comes to the Apple App Store, there are 26 categories, out of which Games, Business, Utilities, Education, Lifestyle, Food & Drinks, and Health & Fitness are the top 7 categories.
- Education is a top Android category, with 348,355 free and 10,292 paid educational applications.
- Games are the top iOS category, including 208,164 free gaming applications and 14,890 paid apps.
- When comparing app releases on the Google Play Store and Apple App Store, there are 1,290 and 1,434 daily apps, 8,157 and 9,245 weekly apps, and 39,849 and 41,280 monthly apps, respectively.
- Of all the existing applications, 217,656 Android and 268255 iOS applications have received 5-star ratings, while 10000 Android applications and 47,000 iOS applications have received a 1-star rating.
Source: 42Matters
You must be wondering why we are even listing these stats here, right?
Remember, these stats will significantly impact your basic research if you consider expanding your business through mobile app development. For instance, if you are thinking about releasing your app for Android users only, it will be more beneficial for you to introduce free apps as 97% of Android apps are free, and they receive more downloads compared to paid ones.
Other than that, being just one of the applications, but missing out on the apps with higher download rates and 5-star rating clubs can affect your brand reputation and investment. Thus, considering these
stats can minimize your chances of hitting the loss. But is this all? Of course not. We have more mobile app market growth stats to share with you.
Most Popular Apps Based on Various Categories
 When it comes to popularity, mobile app development growth has been constant over the years in every possible segment.
Most Popular Apps – Based on Downloads
Instagram was the most popular app, with 696 million downloads, while TikTok was the second most popular app, with 654 million users. Facebook, WhatsApp, and CapCut got third, fourth, and fifth place with 553 million, 457 million, and 389 million downloads, respectively.
This statistic sums up that four out of 10 of the most downloaded apps were published by Meta. Though Instagram has the most downloads globally, country-wise data tells a different story.
Most Popular Apps – Country Wise
When we talk about the target audience, the most important factor is your target country. Let’s focus first on the USA.
| Country | Mobile Application | Downloads |
|---|---|---|
| USA | Temu | 103 Million |
| UK | Temu | 15 Million |
| China | 1012.4 Million | |
| India | 245 Million | |
| Brazil | Shein | 49 Million |
| Germany | Temu | 13 Million |
| France | Temu | 12 Million |
| Italy | Temu | 9 Million |
| Spain | Temu | 9 Million |
| Canada | Temu | 9 Million |
Above all, Temu ranked as the most downloaded app in 7 out of 10 countries. Thus it is important to consider the country base of your target audience to determine the success of your application.
Most Popular Apps – By Platform
Does it matter whether your target audience is Android users or iOS users? Yes, it does. We have stats to back up this statement as well.
Top 5 Most Popular iOS Mobile Applications
| Mobile Applications | Downloads |
|---|---|
| USA | 140 Million |
| Temu | 132 Million |
| TikTok | 128 Million |
| YouTube | 121 Million |
| 119 Million |
Top 5 Most Popular Android Mobile Applications
| Mobile Applications | Downloads |
|---|---|
| 521 Million | |
| 469 Million | |
| Tiktok | 460 Million |
| 363 Million | |
| Snapchat | 282 Million |
The above comparison clearly states that entertainment applications rule the platform when it comes to Android. In contrast, when it comes to iOS, photo-editing apps, shopping apps, and entertainment apps altogether rule the platform.
As you can see, all the popular apps are free for users to browse. But what about their earnings? Popularity is the only thing we can get. Or is there any way to earn from the applications? Well, yes, there are ways to earn from your apps directly.
We’re here to offer you custom mobile app development solutions
Most Popular App Monetization Methods
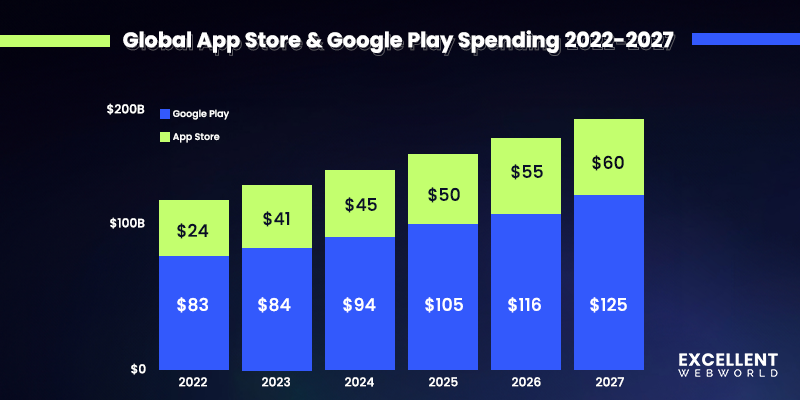
Monetization methods have been the driving force behind the growth of mobile apps. In 2027, consumers are projected to spend 125 billion U.S. dollars on mobile apps from the Apple App Store and 60 billion U.S. dollars from the Google Play Store.
In-App Advertising
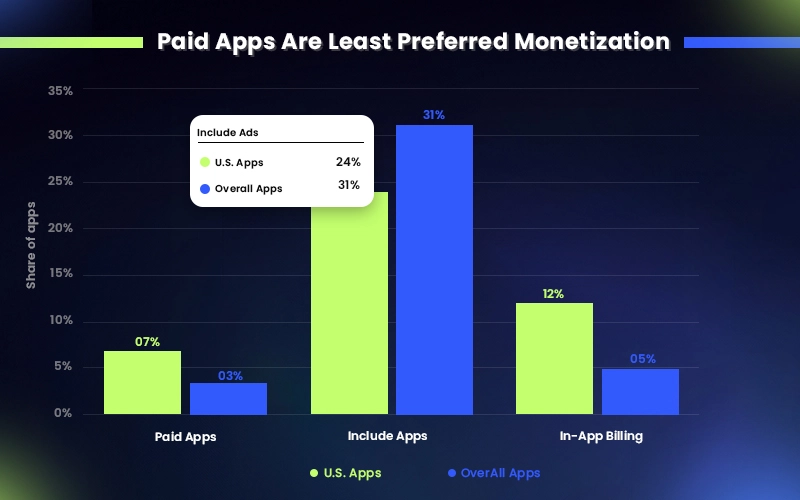
In-app ads are the most preferred app monetization method for global and USA-based audiences. As of September 2025, 25% of USA-based applications earned from in-app ads, while 27% of overall apps earned through in-app ads.
In-App Billing
In-app billing is the second most preferred app monetization method, and 12% of USA-based apps and 5% of worldwide apps earn through it.
Paid Apps
Paid apps are the least preferred app monetization method, with only 7% of USA-based apps and 3% of worldwide apps earning through them.
Mobile App Revenue Data
Total revenue in the app market crossed US$420.80bn in 2022, which is projected to cross the projected market volume of US$673.80bn by 2027. Apart from that, there are a few other app revenue statistics you should consider.
Revenue by Type
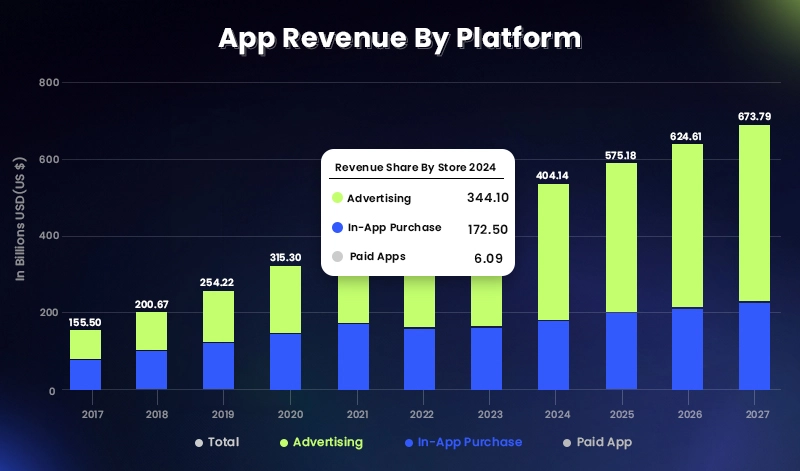
When it comes to the revenue comparison, app advertising ranks first, with 344.10 billion USD. Global applications are projected to earn 172.50 billion USD through in-app purchases, while paid apps generated the least revenue, with 6.09 billion USD by the end of 2025.
Revenue by Platform
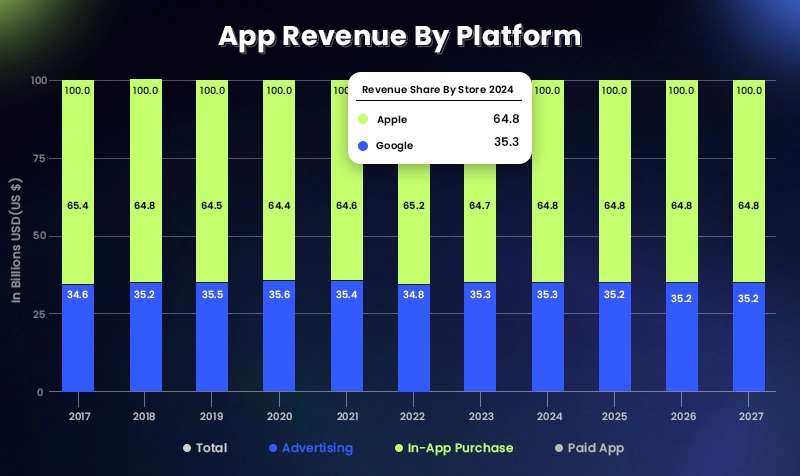
For revenue generation, the Apple App Store has earned 64.7%, while the Google Play Store has generated 35.3%, which is projected to cross 64.8% and 35.2% for the Apple App Store and Google Play Store, respectively.
Revenue Based on Categories
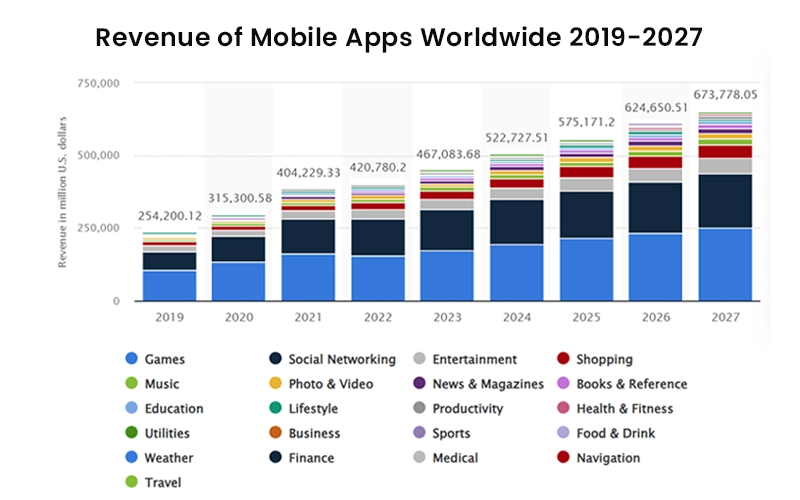
From 2017 to 2024, shopping applications generated the highest average revenue per download, which is predicted to cross 27.92 USD by 2027.
Conclusion – Mobile App Usage Statistics
So, that is all about the mobile app stats, however, things do not end here. The numbers shown to you keep updating and increasing day by day.
The evolving trends in mobile app development, such as the integration of artificial intelligence, augmented reality, and advanced data analytics, promise to further enhance user experiences and app functionalities. As technology continues to advance, we can expect mobile apps to become even more sophisticated and integral to our lives.
The best part of this article is by learning these statistics and insights you can get the maximum output for your mobile app. To be competitive and enhance your app’s user engagement, our mobile app development company has a team of experts who have years of experience.
We offer you tech-edge mobile app development services by leveraging our core expertise to build or upgrade your application.
Thus, if you are considering developing a mobile application, this is the right time to reach out to our app development team and share your queries to get the best out of it.
Frequently Asked Questions
According to some of the research, global app usage statistics show over 7 billion mobile users worldwide, with more than 218 billion app downloads annually. The average user spends about 4.8 hours per day on mobile apps, with social media, gaming, and entertainment apps being the most popular
The fact is a good user retention rate varies from industry to industry. But if we set an average benchmark then a successful mobile app should have at least 25% of the users retention after a month. And for a more successful application, it should be around 50% of the user retention rates.
The mobile app market is substantial, with a projected value exceeding $935 billion by 2024. This growth is fueled by increasing smartphone penetration, advancements in mobile technology, and the rising demand for apps in various categories such as entertainment, productivity, health, and education. Besides, the market continues to expand every day with new applications.

Article By
Mayur Panchal is the CTO of Excellent Webworld. With his skills and expertise, he stays updated with industry trends and utilizes his technical expertise to address problems faced by entrepreneurs and startup owners.